Logs are an important aspect of monitoring and management. Logs enablement of devices is crucial to perform fault isolation, resolution of issues and also help in locating the root cause of problem for permanent fix. All modern devices have the capability to store and maintain logs by configuring logging parameters.
In today’s topic we will learn about SLA logging capability in FortiOS 6.2, how it is enabled, and how to configure SLA logging in Forti appliances.
About SLA Logging
SLA Logging is a daemon function which helps to keep a short 10-minute history of SLA which can be viewed via command line (CLI). The performance SLAs are related to selection of interfaces, failover of sessions, and other information logged. The logs can be used for monitoring of traffic issues for remote sites, and reports, views in Fortianalyzer.
To Configure ‘fail’ and ‘Pass’ Logs Time Interval
config system virtual-wan-link
config health-check
edit “ping”
set sla-fail-log-period 30
set sla-pass-log-period 60
next
end
end
View 10-minute performance SLA link history
FGT_1 (root) # diagnose sys virtual-wan-link sla-log ping 1
Output
Timestamp: Thu Jan 25 11:58:24 2024, vdom root, health-check ping, interface: R150, status: up, latency: 0.000, jitter: 0.000, packet loss: 0.000%.
Timestamp: Thu Jan 25 11:58:24 2024, vdom root, health-check ping, interface: R150, status: up, latency: 0.097, jitter: 0.000, packet loss: 0.000%.
Timestamp: Thu Jan 25 11:58:25 2024, vdom root, health-check ping, interface: R150, status: up, latency: 0.015, jitter: 0.25, packet loss: 0.001%.
Related: SLA vs SLO vs SLI
SLA Pass Logs
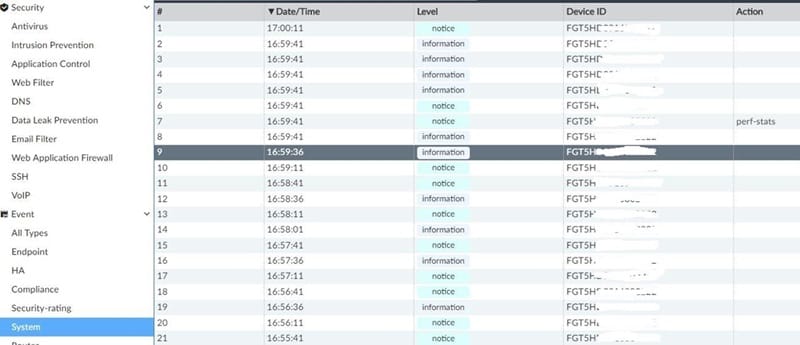
FortiGate generates SLA performance logs as per (sla-pass-log-period) interval
3: date=2024-01-25 time=10:53:26 logid=”0100022926″ type=”event” subtype=”system” level=”information” vd=”root” eventtime=1551383304 logdesc=”Link monitor SLA information” name=”ping” interface=”R160″ status=”up” msg=”Latency: 0.005, jitter: 0.002, packet loss: 0.000%, inbandwidth: 0Mbps, outbandwidth: 0Mbps, bibandwidth: 0Mbps, sla_map: 0x1″
7: date=2024-01-25 time=11:52:26 logid=”0100022926″ type=”event” subtype=”system” level=”information” vd=”root” eventtime=1551383544 logdesc=”Link monitor SLA information” name=”ping” interface=”R160″ status=”up” msg=”Latency: 0.013, jitter: 0.002, packet loss: 0.000%, inbandwidth: 0Mbps, outbandwidth: 0Mbps, bibandwidth: 0Mbps, sla_map: 0x1″
In FortiAnalyzer (GUI)

SLA Fail Logs
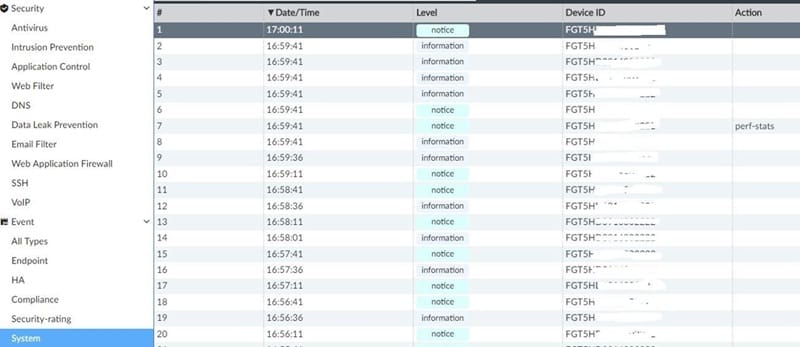
FortiGate generates SLA performance logs as per (sla-fail-log-period) interval
6: date=2024-01-25 time=11:52:32 logid=”0100022926″ type=”event” subtype=”system” level=”notice” vd=”root” eventtime=1551383551 logdesc=”Link monitor SLA information” name=”ping” interface=”R150″ status=”down” msg=”Latency: 0.000, jitter: 0.000, packet loss: 100.000%, inbandwidth: 0Mbps, outbandwidth: 200Mbps, bibandwidth: 200Mbps, sla_map: 0x0″
8: date=2024-01-25 time=11:52:02 logid=”0100022926″ type=”event” subtype=”system” level=”notice” vd=”root” eventtime=1551383521 logdesc=”Link monitor SLA information” name=”ping” interface=”R150″ status=”down” msg=”Latency: 0.000, jitter: 0.000, packet loss: 100.000%, inbandwidth: 0Mbps, outbandwidth: 200Mbps, bibandwidth: 200Mbps, sla_map: 0x0″
In FortiAnalyzer (GUI)

Related FAQs
Q.1 What is SLA logging, and why is it important?
- SLA logging involves recording and tracking the performance metrics and service commitments outlined in an SLA. It’s important for ensuring that service providers meet agreed-upon standards, for accountability, and for identifying areas for improvement.
Q.2 What metrics are typically tracked in SLA logging?
- Common metrics include uptime or availability percentage, response and resolution times, incident frequency, and quality metrics such as error rates or customer satisfaction scores. These metrics help quantify performance and ensure compliance with SLA terms.
Q.3 How does SLA logging benefit both service providers and customers?
- SLA logging helps providers demonstrate compliance with agreed standards, potentially avoiding penalties and building trust. For customers, it ensures that service commitments are met, providing transparency and accountability in service delivery.
Q.4 What tools are commonly used for SLA logging?
- SLA logging often involves IT service management (ITSM) tools like ServiceNow, BMC Remedy, or Jira, which can automate logging and reporting. Some monitoring solutions like Datadog, SolarWinds, and Zabbix also offer SLA logging features.
Q.5 How frequently should SLA logs be reviewed and analyzed?
- Review frequency depends on the service’s criticality and SLA terms. Monthly reviews are common, but critical services may require daily or weekly checks. Regular analysis helps in proactive issue identification and improvement planning.